A 3% growth rate can be strong in one country and weak in another. Each country runs at a different historical normal, so numbers are not directly comparable across borders.
A weak report in one country might be noise. The same weakness appearing across economies is a macro signal.
Large institutions build them with in-house macro teams. Replicating that work requires both global macro investing experience and the data engineering to operationalize it.
We turn raw macroeconomic data into comparable cross-country signals,
serving professional investors in global capital allocation.
License includes weekly data file updates, methodology documentation, and access to the navigation terminal.
Apply for AccessThe first decision was which macroeconomic indicators matter to a global investor and which to leave out.
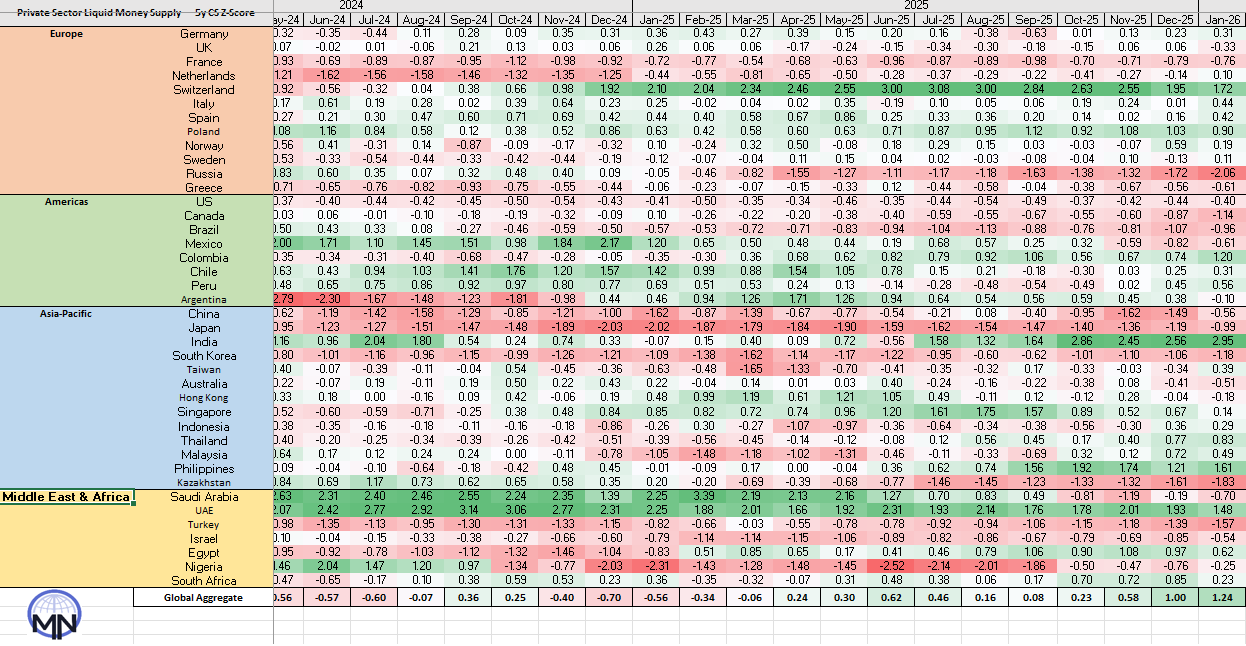
Chosen indicators are then standardized, so a +1.5 in Brazil is the same distance from normal as a +1.5 in Korea.
From there, you can see which countries stand out, and how broadly a move is shared across them.
Data organised in 5 macro modules containing 30+ indicators covering up to 41* economies, including global aggregates. Several decades recorded.
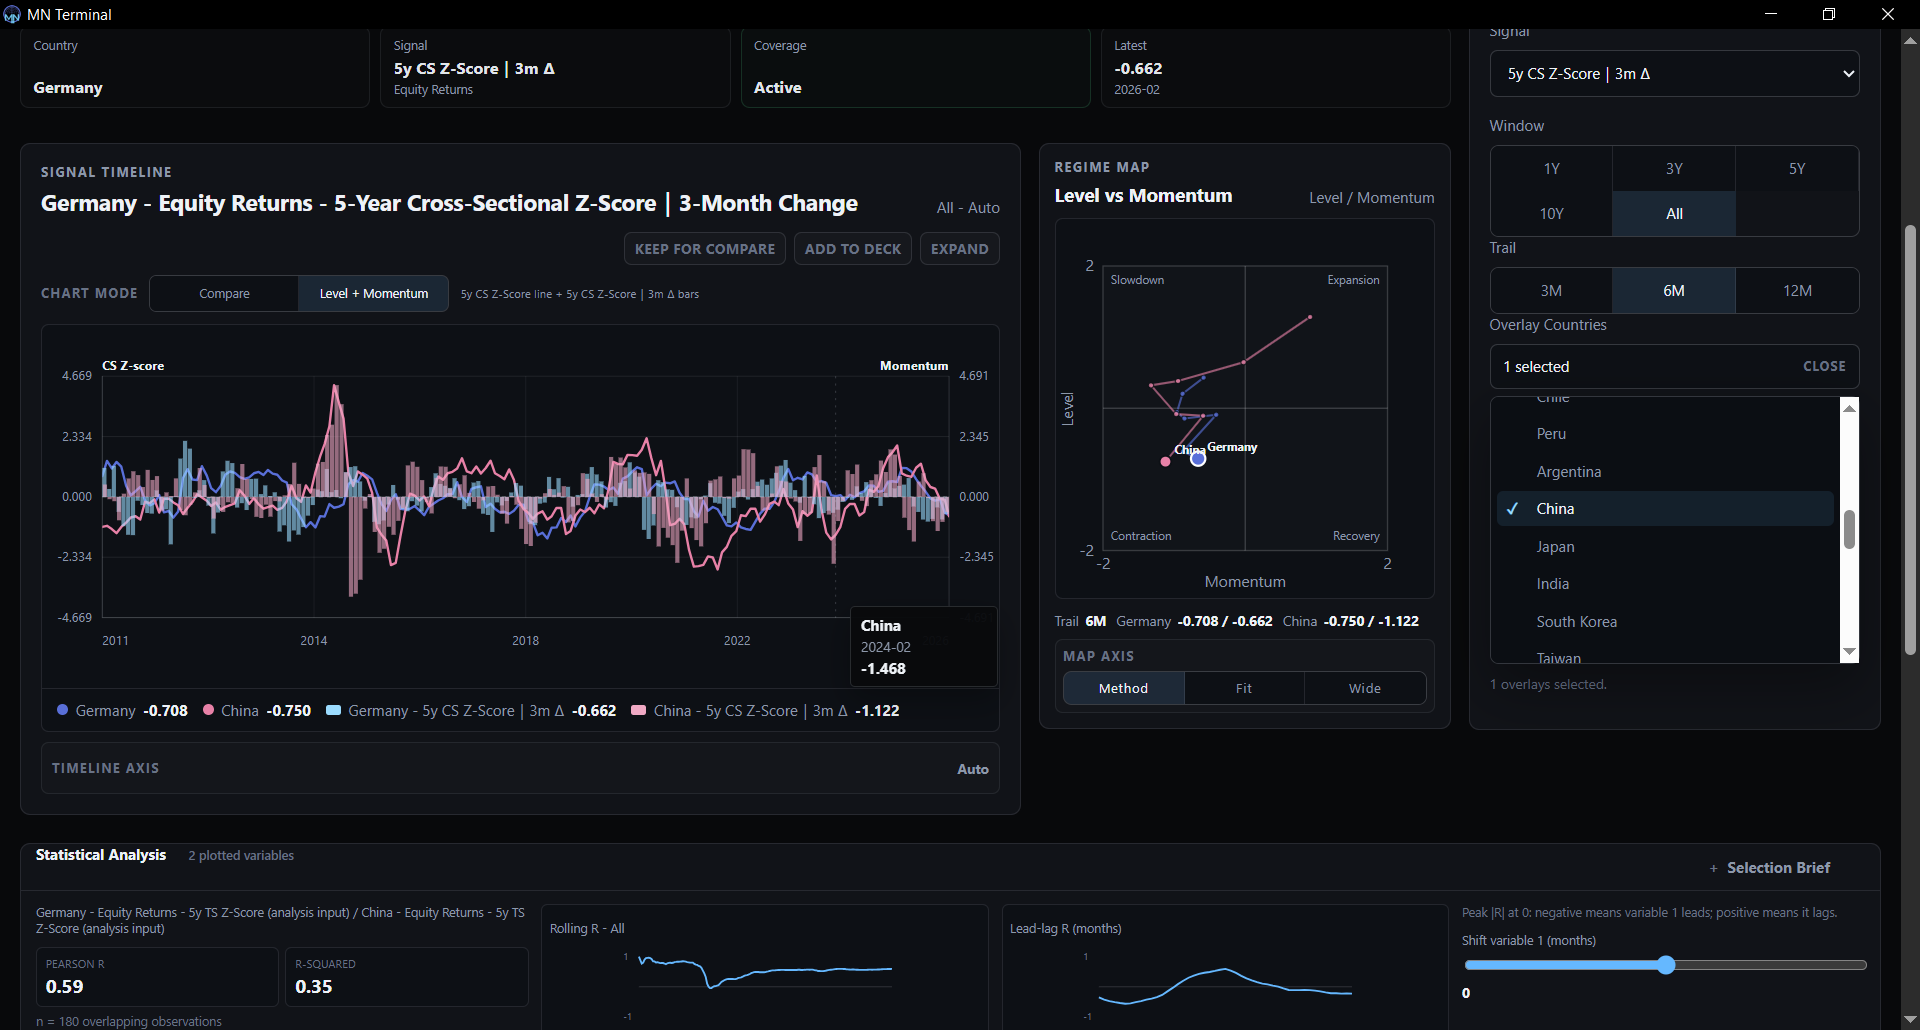
The MN Terminal is a local desktop application that loads all data files into one interface and rescans them the moment updates arrive. It navigates across all files and gives you full controls: overlay plots of different signals, across countries and across indicators, and measure how they move together.
Economist and global macro investor, built and maintains the datasets for his own investment process. Founded Macro Navigation to share them with other investors.
Computational scientist and researcher; engineer for the MN Terminal.
Apply for a license, request detailed methodology, or book a meeting